Analytics is the systematic computational analysis used for the discovery, interpretation, and communication of meaningful patterns in data. Organizations apply analytics to business data to describe, predict, and improve business performance.
The amount and type of available data have grown exponentially. Access to this pool of information creates a significant competitive advantage and provides a unique opportunity to conduct in-depth analysis for critical business improvements and gaps in the market to exploit.
Organizations can leverage data to improve cost savings, redefine processes, drive market strategy, establish competitive differentiators and, perhaps most importantly, build an exceptional and truly personalized customer experience. As a result, analytics has become one of the most important tools at an organization’s disposal.

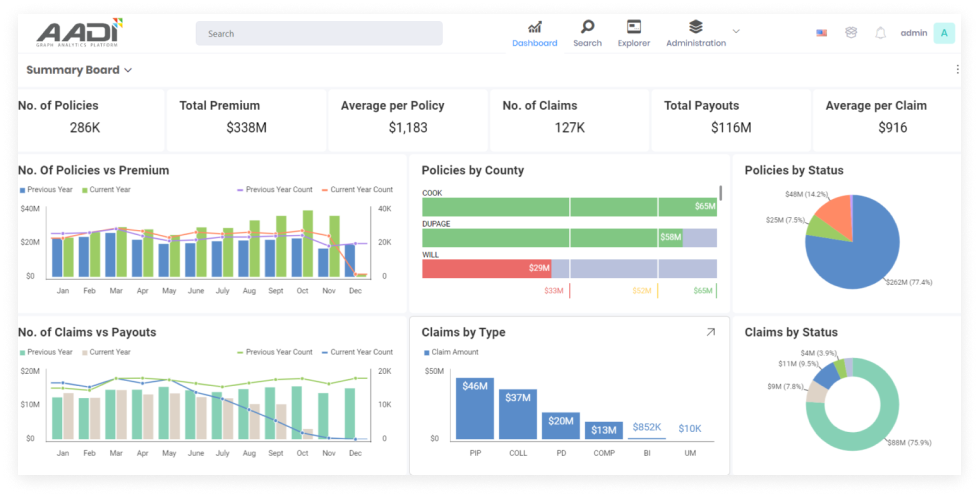
All vendors offer reports. But can the reports be created in minutes or hours instead of days or weeks? Can your users create their own powerful, data-driven dashboards? AADI was built to provide enterprise reports pulling and comparing data from ALL your data sources, not just your Claims system or your Policy system.
The AADI Graph Analytics Platform is the core application built to apply leading-edge computational data analytics algorithms to enable user-focused results. We help our customers consolidate data from disparate sources to build a Unified view of the data and using AADI provides information for decision making.
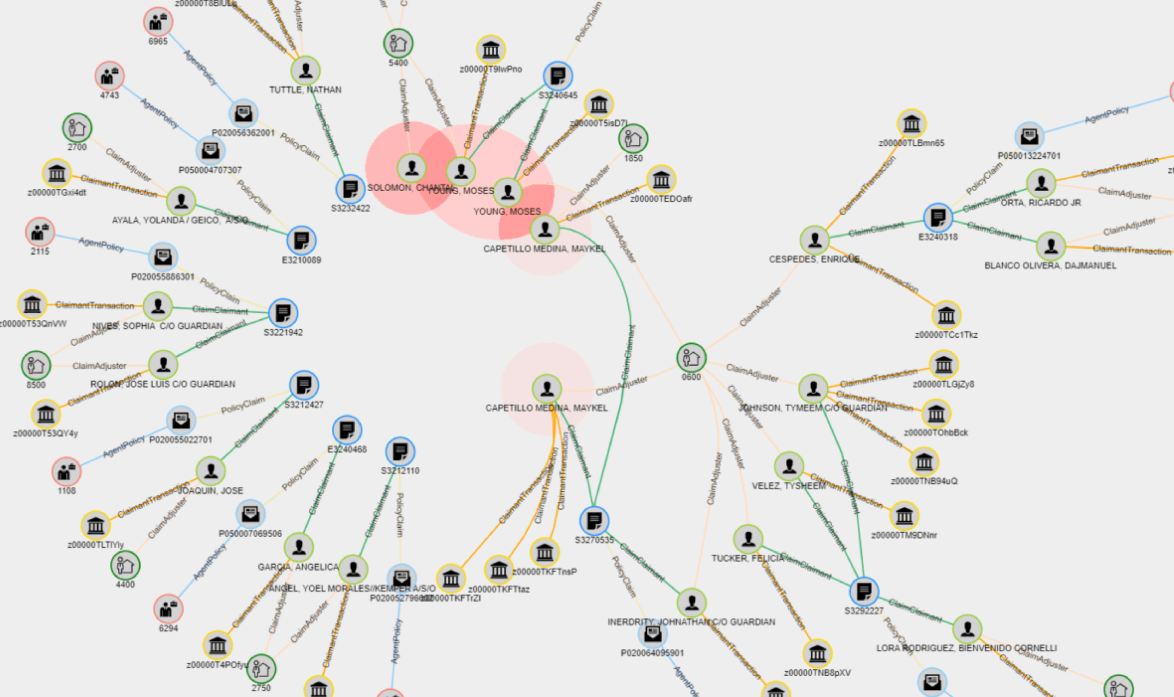
AADI Graph Analytics Platform offers powerful data analytics and dashboarding functionality. It is easy to create, automate, analyze, and visualize multiple complex datasets to discover hidden patterns. The data is interpreted and presented in different visualizations that can be changed on the fly.
AADI offers rich features in Graph Analytics, Traditional BI, and Visualization, tailored to your needs.
Customizable Graph Analytics
User-Friendly Interface
Trend Identification
Powerful Collaboration
Unified Analytics
Data Management
Complete Analytics Cycle
Advanced Reporting
AI/ML Integration
Pre-built Data Pipelines
Self-Service Dashboards
Intuitive Filtering


Like what you’ve seen? Get in touch to learn more.
